Your first performance budget with Lighthouse
I asked on Twitter the other day how many people had created and enforced a performance budget for a website they were working on. Not surprisingly, the vast majority of people hadn't.
I'm curious, have you ever created (and enforced) a performance budget for a site you're working on? — Ire Aderinokun (@ireaderinokun) May 24, 2019
Until recently, I also hadn't setup an official performance budget and enforced it. This isn’t to say that I never did performance audits. I frequently use tools like PageSpeed Insights and take the feedback to make improvements. But what I had never done was set a list of metrics that I needed the site to meet, and enforce them using some automated tool.
The reasons for this were a combination of not knowing what exact numbers I should use for budgets as well as there being a disconnect between setting a budget and testing/enforcing it. This is why I was really excited when, at Google I/O this year, the Lighthouse team announced support for performance budgets that can be integrated with Lighthouse. We can now define a simple performance budget in a JSON file, which will be tested as part of the lighthouse audit!
The Lighthouse performance budget #
As we know, there are countless performance metrics out there. From user-centric milestones such as Time to Interactive, to resource-centric metrics such as the size of your javascript files.
The performance budget we can set on Lighthouse focuses on the latter and is purely based on the raw values of your website’s assets and resources. There are two types of budgets we can create:
- The number of a given resource - e.g., a budget which enforces that only 2 javascript files be loaded by the given page
- The size of a given resource - e.g., a budget which enforces that the given page only loads 500kb of javascript
Creating the budget.json #
Lighthouse expects the performance budget to be written in a JSON file, typically named budget.json.
The JSON file is setup as an array of objects, each object being a set of budgets for a single path. It should be noted that currently, Lighthouse only supports one set of budgets for one path, which means that the array in budgets.json should only have one object. However, the intention is that we'll be able to specify budgets for different paths in a single file, so it's setup this way for future proofing.
The main budget object is organised by budget type (resourceCounts or resourceSizes), each containing an array of budgets for each type of resource. For example, let’s create a budget.json that enforces the following budget -
- 10 third-party resources
- 300kb Javascript
- 100kb CSS
Here’s what the corresponding budget.json would look like:
[
  {
    "resourceCounts": [
      {"resourceType": "third-party","budget": 10}
    ],
    "resourceSizes": [
      {"resourceType": "script","budget": 300},
      {"resourceType": "stylesheet","budget": 100}
    ]
  }
]
The following resource types are available:
| Resource type | Description |
|---|---|
document |
HTML documents |
script |
Javascript files |
stylesheet |
CSS files |
image |
Images |
media |
Other media |
font |
Webfonts |
other |
Any resources that don’t match the above, e.g. data transfers over Websocket connections |
third-party |
All resources from a third-party domain |
total |
All resources combined |
Choosing a performance budget #
Now that we know how to create a performance budget, the next question is what should we put in it? Although the answer to this will change dramatically depending on the specifics of your site, you can use this Performance Budget Calculator to get an idea of what different budgets will mean for user-centric metrics such as time to interactive.
For the example, the default budget below will result in an estimated 4.4s time to interactive:
[
  {
    "resourceSizes": [
      {"resourceType":"document","budget":20},
      {"resourceType":"stylesheet","budget":50},
      {"resourceType":"font","budget":50},
      {"resourceType":"image","budget":300},
      {"resourceType":"script","budget":100}
    ]
  }
]
Enforcing the performance budget with Lighthouse #
At the moment, the performance budget can only be consumed by the Lighthouse CLI. This means that we can’t yet use it with the in-browser audit panel or online tools like PageSpeed Insights or Web.dev. These integrations are being worked on, but for now, there are primarily 2 ways you’ll want to use the Lighthouse performance budget.
Basic command line usage #
The simplest way is to install the Lighthouse CLI, and run the audit command, passing in your budget.json file as an option.
lighthouse [url] --budget-path=[path/to/budget.json]For example:
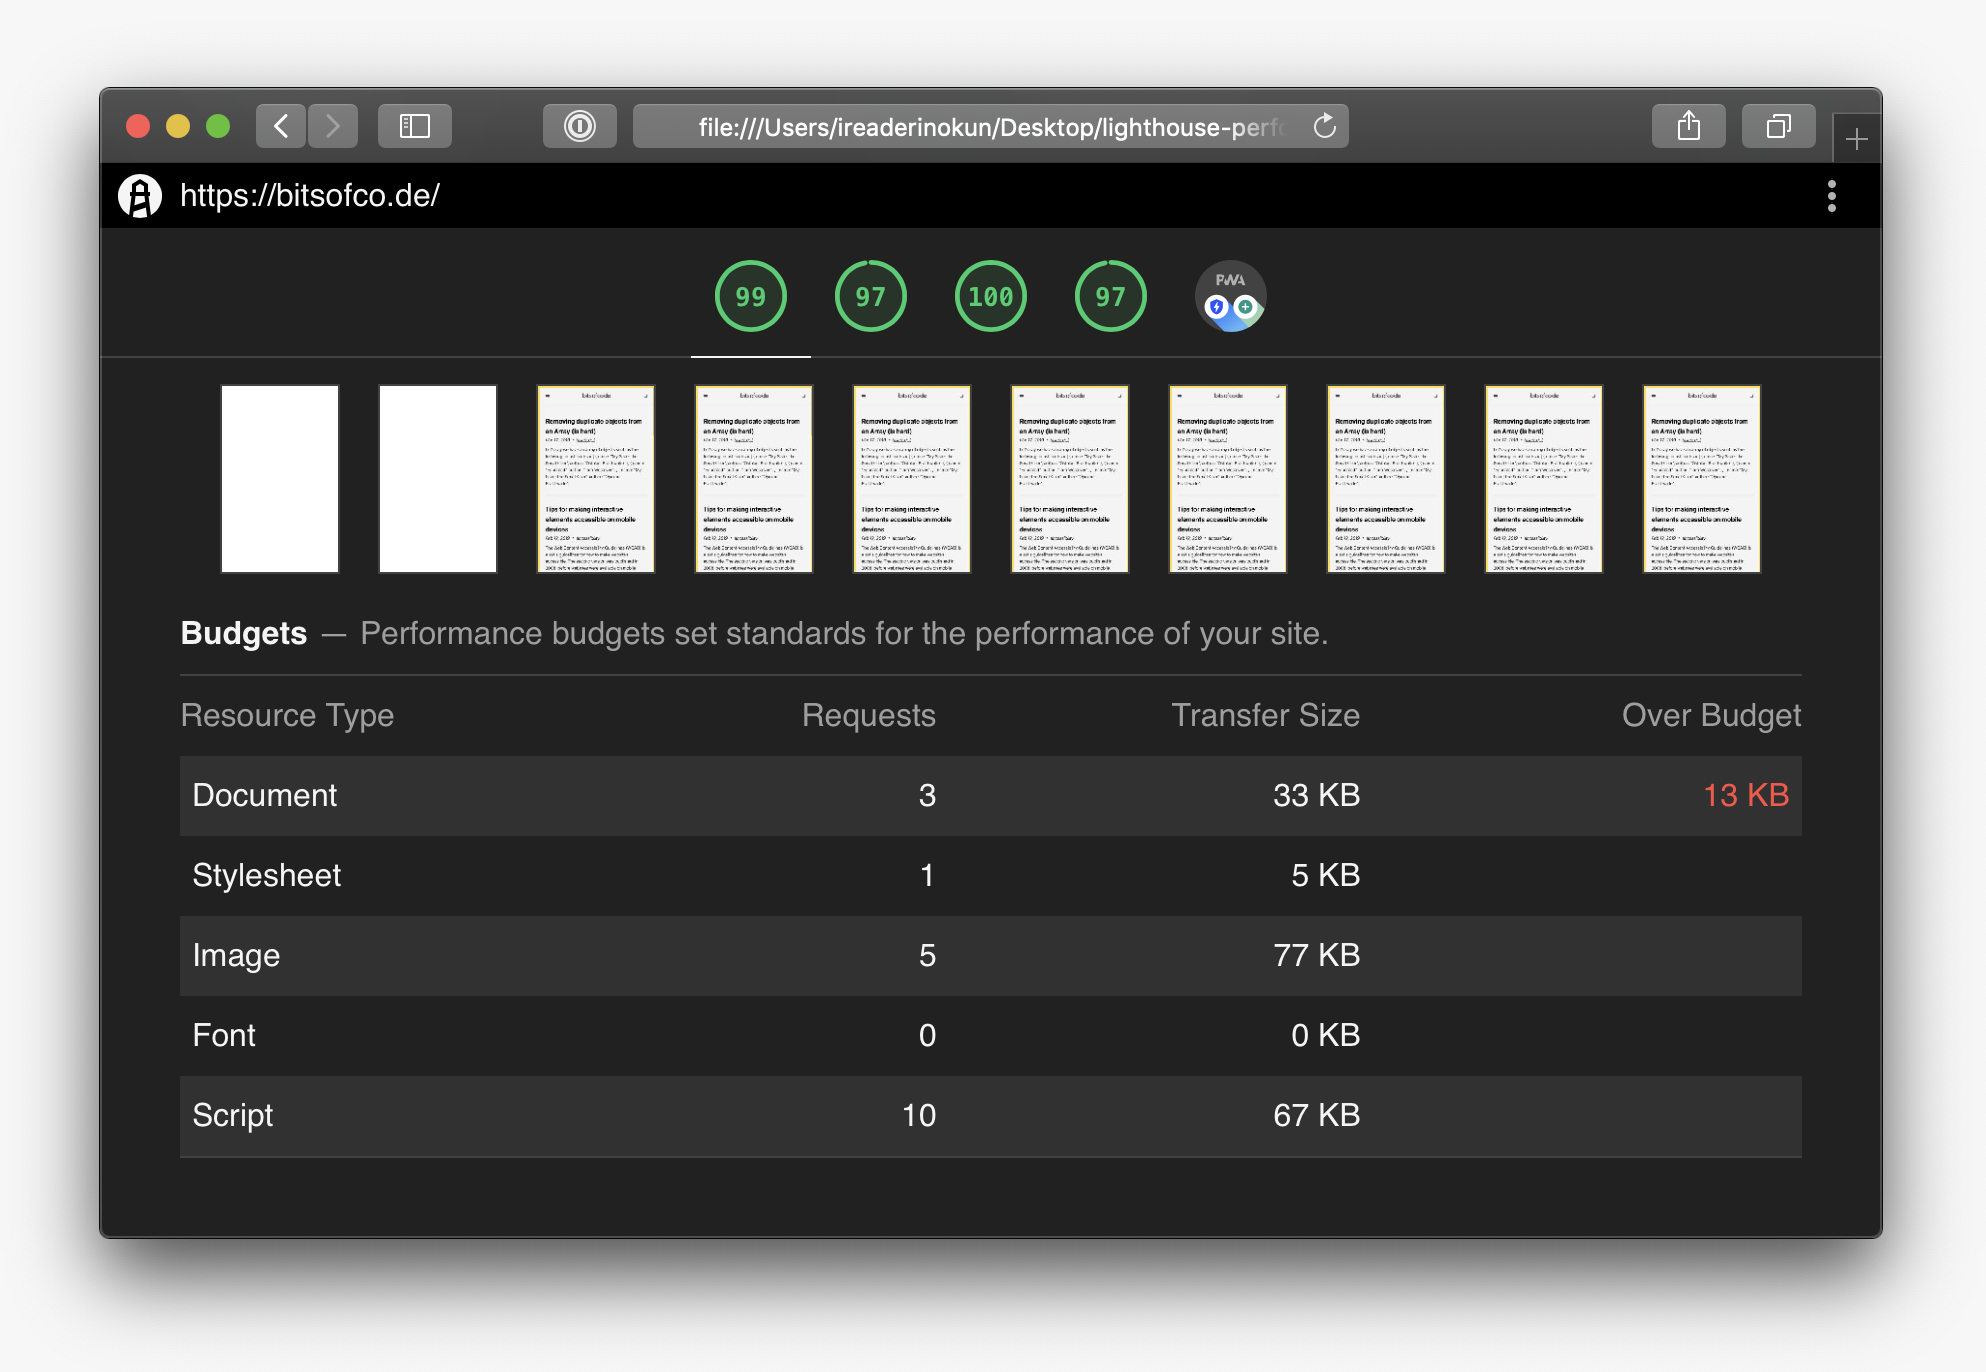
lighthouse https://bitsofco.de --budget-path=budget.jsonThis command will trigger the lighthouse audit and will output the typical lighthouse results page with one addition - a section on how your page performs against your specified budgets.

Continuous integration #
Because the audits are available using the command line interface, they can be used wherever the CLI can be installed. This means we can include it in our continuous integration process.
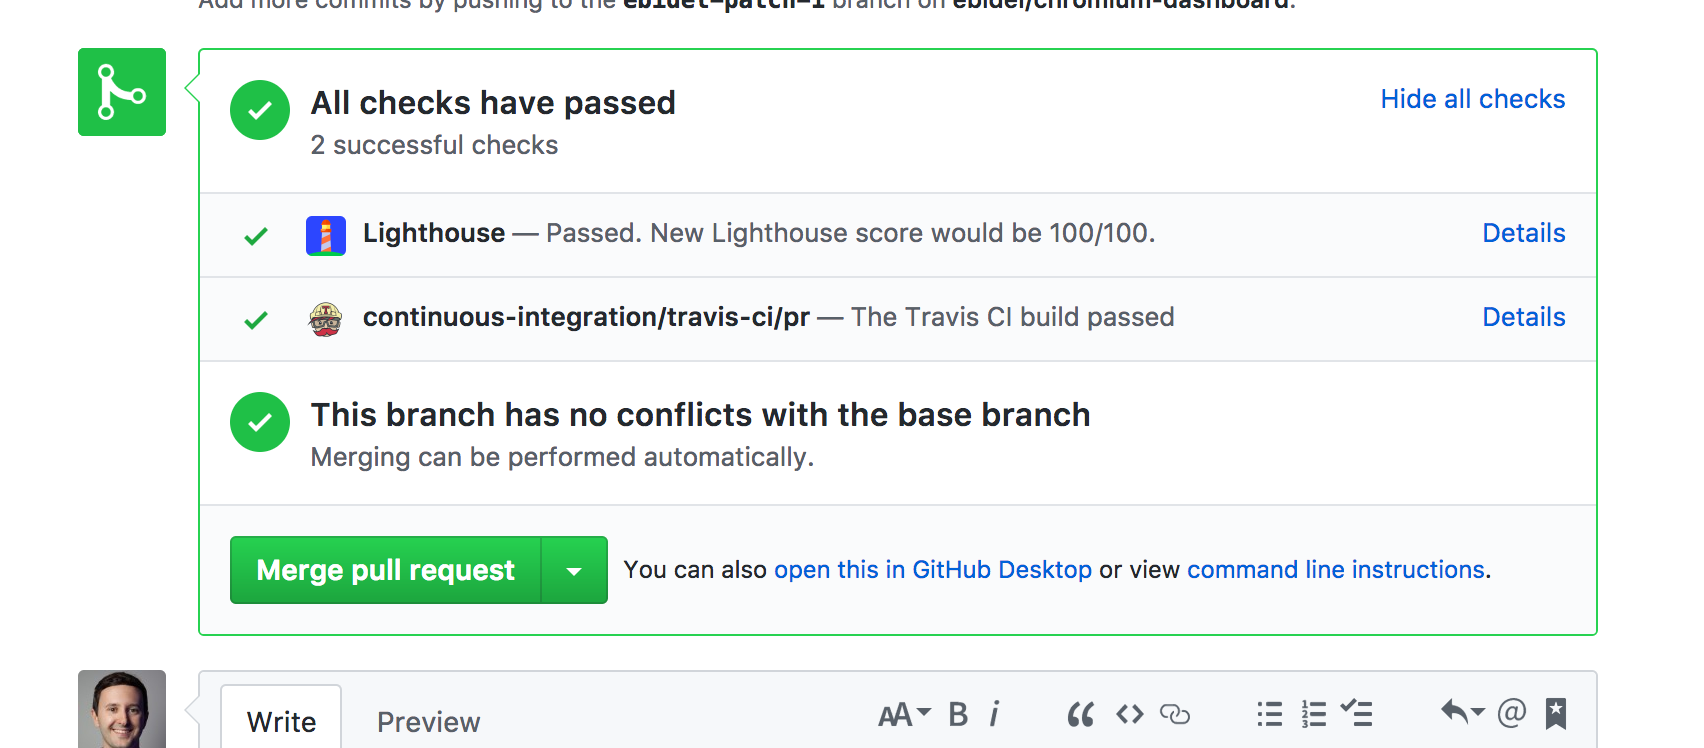
There’s an excellent article on web.dev that shows how you can setup the Lighthouse Bot to run checks against GitHub Pull Requests.

Image from github.com/GoogleChromeLabs/lighthousebot
This is probably the best way to set things up so the checks happen automatically.
