Web Performance Metrics Cheatsheet
I recently gave a talk on “Making Sense of Performance Metrics” at the Web Unleashed Conference, and it was suggested that I turn the breakdown of all the performance metrics into a cheatsheet; so here it is!
The full cheatsheet, including a downloadable PDF version, are at the bottom of the page so feel free to skip to that.
Four Questions #
In a web.dev article on "User-centric Performance Metrics", they frame performance metrics around four questions:
- Is it happening?
- Is it useful?
- Is it usable?
- Is it delightful?
I really like this framework as a way to better understand what aspect of the user experience each metric is tracking.
1. Is it happening? #
This is about measuring if there is any response after a user starts the navigation to the page. There are three metrics that fall under this category.
Time to First Byte (TTFB) #
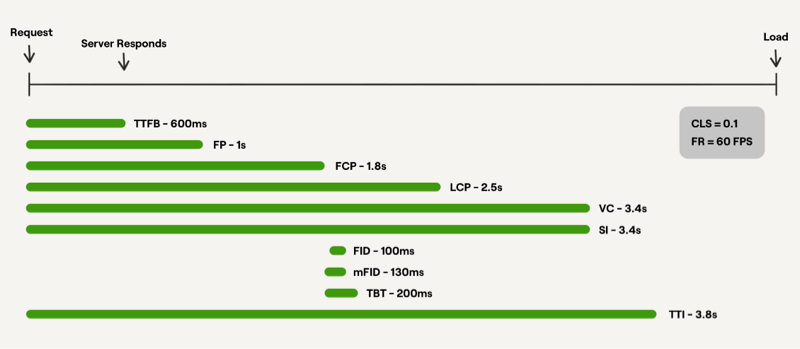
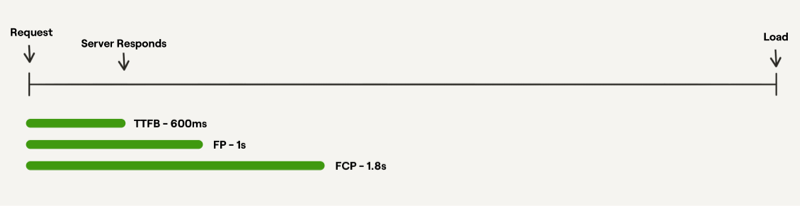
Time to First Byte measures the time from when the browser requests a page to the first byte of the page being received. This is really useful for measuring the roundtrip between the user’s device and the server. A good number to aim for is 600 milliseconds or less.
First Paint (FP) #
First Paint measures the time when the first pixel is painted on the screen. This isn't the most user-centric metric, since at first paint there still isn't any content on the screen, but it's useful to know. Because it's not so user-centric, I wasn't able to find any reliable guidelines for what a good number for FP should be, but it should of course fall somewhere between TTFB and and FCP.
First Contentful Paint (FCP) #
First Contentful Paint measures the time when the first piece of content from the DOM is rendered. This is a useful metric to track because this is the point at which a user actually gets recognisable feedback. A good number for this is 1.8 seconds or less.
2. Is it useful? #
While the previous metrics measure if there is any content on the page, these metrics measure if the content rendered is actually useful or meaningful to a user.
Largest Contentful Paint (LCP) ⭐️ #
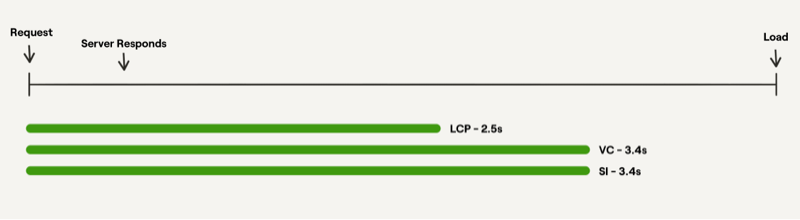
Largest Contentful Paint, one of the three Core Web Vitals, measures the time when the largest piece of content within the viewport is rendered. It can also be configured to measure when a specific piece of content is loaded, instead of just the largest by size. LCP is a successor to the First Meaningful Paint metric, which is no longer recommended as it is not standardised. A good number for LCP is 2.5 seconds or less.
Visually Complete (VC) #
Visually Complete measures the time taken for the content within the viewport to be fully rendered. It's based on an algorithm that sets "visual completion" as the capture of the frame that is the least different to the final frame. There are different Visual Complete metrics you can use based on what percentage to completeness you are trying to track, e.g. Visually Complete 85% etc. A good number for VC is 3.4 seconds or less.
Speed Index (SI) #
Speed Index is a similar score to Visually Complete in that is also measures how quickly content is visually displayed during the page load. However, SI also takes into account how your site performs in comparison to other sites on the web. Like VC, a good number to aim for is 3.4 seconds or less.
3. Is it usable? #
These metrics are about measuring if a user can actually interact with the content that has been rendered.
First Input Delay (FID) ⭐️ #
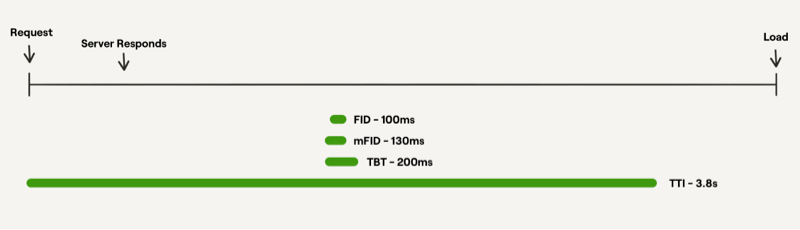
First Input Delay, another Core Web Vital, measures the delay between the time a user can attempt to interact with a part of the site, and the time that the interface is able to respond to that interaction. This is an important metric to track because, generally, if users see an interactive element such as a button, they assume that it can be interacted with reliably. If there is a delay between when a user presses the button and when they get feedback, this can become an issue. Ideally, FID should not surpass 100 milliseconds.
Max Potential First Input Delay (mFID) #
Max Potential First Input Delay measures the maximum possible First Input Delay that could occur based on the duration of the longest task. This is a useful metric to have because FID is a field metric, which means it's based on real user data and cannot be measured by page simulations (i.e., in the lab). So, if you want an approximation of the worst case scenario of FID while you're still in a lab setting, mFID is a good option. Ideally, mFID should be 130 milliseconds or less.
Total Blocking Time (TBT) #
Total Blocking Time measures the total duration of Javascript tasks between the First Contentful Paint and Time to Interactive. This metric gives us a sense of how long a user could potentially be waiting if there are several blocking tasks. Because while mFID tells us the duration of the longest blocking task, a user may end up waiting even longer than that if there are several blocking tasks in a chain. TBT is expected to be 200 milliseconds or less.
Time to Interactive (TTI) #
Time to Interactive measures the time when the main thread has had up to 5 seconds with no network activity or JavaScript tasks. Having up to 5 seconds clear is important because that’s when the main thread is clear enough to reliably respond to user input. TTI should be at most 3.8 seconds.
4. Is it delightful? #
Finally, this category of metrics measures the experience of the interactions and how enjoyable and pleasant the website is to use.
Cumulative Layout Shift (CLS) ⭐️ #
Cumulative Layout Shift, the third Core Web Vital, measures the shifts in layout while a page is loading. This metric is calculated based on how much elements shift relative to the viewport (impact fraction) and what distance they travel (distance fraction). A good score for CLS is 0.1 or less.
Frame Rate #
Frame rate is the rate at which the browser can produce new frames in response to interactions and/or animations. The standard for a smooth frame rate is 60 frames per second.
The Cheatsheet #
Here are all the metrics together, including what a good score is to aim for, and whether they can be measure in the lab or field.
| Metric | Description | ✅ | Lab? | Field? |
|---|---|---|---|---|
| Time to First Byte (TTFB) | Measures the time from when the browser requests a page to the first byte of the page being received | <600ms | ✅ | ✅ |
| First Paint (FP) | Measures the time when the first pixel is painted on the screen | <1.8s * | ✅ | ✅ |
| First Contentful Paint (FCP) | Measures the time when the first piece of content from the DOM is rendered | <1.8s | ✅ | ✅ |
| Largest Contentful Paint (LCP) ⭐️ | Measures the time when the largest piece of content within the viewport is rendered | <2.5s | ✅ | ✅ |
| Visually Complete (VC) | Measures the time taken for the content within the viewport to be fully rendered | <3.4s | ✅ | ❌ |
| Speed Index (SI) | Measures how quickly visual content is rendered within the viewport | <3.4s | ✅ | ❌ |
| First Input Delay (FID) ⭐️ | Measures the delay between the time a user can attempt to interact with a part of the site, and the time that the interface is able to respond to that interaction | <100ms | ❌ | ✅ |
| Max Potential First Input Delay (mFID) | Measures the maximum possible First Input Delay based on the duration of the longest task | <130ms | ✅ | ❌ |
| Total Blocking Time (TBT) | Measures the total duration of Javascript tasks between the FCP and TTI | <200ms | ✅ | ❌ |
| Time to Interactive (TTI) | Measures the time when the main thread has had up to 5 seconds with no network activity or JavaScript tasks | <3.8s | ✅ | ❌ |
| Cumulative Layout Shift (CLS) ⭐️ | Measures the shifts in layout while a page is loading | <0.1 | ✅ | ✅ |
| Frame Rate (FR) | Measures the rate at which the browser can produce new frames in response to interactions and/or animations | 60 FPS | ✅ | ✅ |